Pages

Showing posts with label dividend growth. Show all posts

Wednesday, January 23, 2019

Odds of beating the market over many years -- continued

An earlier post shows just how difficult it is to beat the market over many years.

For instance, with a 45 percent chance of beating the market over one year, the probability of beating the market 9 or more years out of 12 is small -- just 36 times out of 1,000, or 3.6 percent (add the probabilities for 9, 10, 11, and 12 years in the figure below). And beating the market 11 or more years out of 12 is truly comically tiny -- just 11 times out of 10,000, or 0.11 percent.


---

You may object to my 45 percent assumption, but this is roughly the (optimistic) probability of a mutual fund beating the market in a given year. Here's some proof.

In the 1996 edition of Burton Malkiel's exceptional book, "A Random Walk Down Wall Street," he states:

"Over the whole 22-year period since the first edition of this book, about two-thirds of the funds proved inferior to the market as a whole. [Thus the probability of beating the market (or equaling it) is about 33 percent. To be fair, I am not entirely sure whether this is per year. Nor am I sure of the type of return calculation.]"

However a nearby graph in his book gives plenty of detail. In the graph, Malkiel shows the probabilities of the broad market beating the typical general equity fund for each of the last 22 years. Averaging the values over the 22 years, 1973 through 1994, I get a 56.6 percent probability of the market beating the funds each year or a 43.4 percent of the typical general equity fund beating (or equaling) the market each year.

Thus, the 45 percent assumption is not silly.

---

In fact, as the markets have become more efficient, I suspect this 45 percent assumption gives fund managers ample benefit of the doubt. For instance, you will often read that only 25 percent, or so, funds beat the market in the current year.

---

I do not know the statistics for the individual investor but I suspect 45 percent is being quite generous. In fact, typical investor performances in mutual funds have badly trailed the already shoddy performance of the funds. In other words, the typical investor underperforms the typical mutual fund -- most likely because of the usual culprits, namely, greed and panic asserting themselves at precisely the wrong times.

---

Finally, one last point. Some may argue it is the total compound return that matters over many years not how many times someone beats the market. That is certainly true but just remember generating 40 percent one year, far above the market (say), usually implies weak returns the next few years. And because of how investors behave, jumping in at the tail end of the 40 percent, then holding the fund for the next few years, net, they get killed.

Ideally, what you want is consistent returns just above market with moderate risk. Do that and you make a killing.

---

So the next time someone tells you they beat the market, ask them how many times they have beaten the market over a long period. Only then will you get the honest truth -- in my opinion, 70 or 75 percent of the time over a long period is evidence of an extremely strong strategy and performance.

This isn't easy.

---


Notes:

The portfolio in "Investing in Dividend Growth Stocks" has beaten the market 11 times out of the last 12, and really 12 times out of the last 13 years, or 92 percent, a record that is matched by no more than a few, if any, (general purpose) mutual funds over this period. Available on Amazon, https://www.amazon.com/Investing-Dividend-Growth-Stocks-Realistic-ebook/dp/B01N30M6DR/ref=sr_1_4?ie=UTF8&qid=1548278535&sr=8-4&keywords=dividend+growth+stocks and https://www.amazon.com/Investing-Dividend-Growth-Stocks-Realistic/dp/0982287003/ref=sr_1_7?ie=UTF8&qid=1548278535&sr=8-7&keywords=dividend+growth+stocks

The portfolio in "Dividend Growth Whisperer," published in October, 2018, handily hammered the market in the fourth quarter of 2018. The portfolio in this book is an update to the portfolio in "Investing in Dividend Growth Stocks." It also presents a novel (and simpler) variation of the crucial concept of valuation. Available on Amazon, https://www.amazon.com/Dividend-Growth-Whisperer-Understanding-Investment-ebook/dp/B07JMMTM4R/ref=tmm_kin_swatch_0?_encoding=UTF8&qid=1548278590&sr=8-1

The latest edition of "A Random Walk Down Wall Street," https://www.amazon.com/Random-Walk-Down-Wall-Street/dp/1324002182/ref=sr_1_1?ie=UTF8&qid=1548277918&sr=8-1&keywords=a+random+walk+down+wall+street

Monday, January 14, 2019

Starting off on a high. Dividend growth stocks from "Dividend Growth Whisperer" trounce the market in Q4, 2018.

In my new book, Dividend Growth Whisperer, published October 2018, I list 17 dividend growth stocks. While 3 months is a silly period to consider the performance of an (investment) portfolio, just to amuse myself today, I looked at how the portfolio performed during the fourth quarter of 2018.

The portfolio in the book outperformed.

While the market lost 13.55 percent during the fourth quarter -- as measured by Vanguard's S&P 500 mutual fund, VFINX -- the portfolio in my new book lost - "only" - 8.48 percent, a performance 507 basis points ahead of the market. While this degree of loss is a Pyrrhic victory, it is a decent start, considering the blind panic that infected the market at times during the fourth quarter of 2018 -- when far too many people seemed to run out of their Oreo's.

Quite interestingly, and encouragingly, 14 of the 17 stocks profiled in my new book beat the market over this period, a testament to the high quality of the stocks and the portfolio in general.

And while beating the market is not that big a deal for stodgy stocks (many utilities, for instance), these stocks are not stodgy stocks. They share characteristics that should allow them to perform better than the market over the long term -- at least, that's the theory, and that's why I picked them!

If they do what the stocks in my first book, Investing in Dividend Growth Stocks, have done they should outperform the market in bad times (falling less) and good times (rising more) -- a favorable market trait of extreme rarity. Net, over a long period, 5 to 10 years, they should handily outperform the market. At least, that's the theory....

(Even if all this does not come to pass, I believe they should do quite all right. I believe that my dividend growth stocks -- the portfolios in both books -- should beat 90 percent of all funds over a long period, except in very rare instances: rabid markets or long-term performance off a starting atrocious bear period. The portfolio in Investing in Dividend Growth Stocks has done very well, for instance. Quoting from the Amazon page:

"In 2017, the average stock in the book's portfolio returned 23.2 percent, yet again outperforming the market, which returned 21.7 percent, making it ten years out of the last eleven that the portfolio has beaten the market. [It beat the market again in 2018, so that's eleven of the last twelve years that the portfolio has beaten the market.] The portfolio very likely remains the best general purpose diversified portfolio in the market, besting the vast majority of diversified mutual funds, with the best, or among the best, 10-year records to 2017. Over the last eleven years, $1.0 million invested in the portfolio, dividends reinvested, has vaulted to $4.4 million at the end of 2017, ahead of the market by a not too insignificant $2 million -- and with much less risk, meaning as well, for instance, that you are much more likely to hold onto these stocks and actually realize these returns. Such is the benefit to long-term investors of picking these wonderful companies correctly, that is, intelligently.")

---

Many investors fail to appreciate the damage severely bad returns do to a portfolio. For instance, while the book portfolio did beat the market by 507 basis points, it actually is 641 basis points ahead of the market in terms of the returns needed to get back to par -- the book portfolio needs a return of 9.26 percent to get back to par while the market needs a return of 15.67 percent to do the same. That's a considerable victory for the good guys.

Another way to look at all this is to consider the amount of time needed to get these returns. At a market average of 9.5 percent a year, the book portfolio needs a little less than a year. The market however would need 1.60 years. So, in a sense, we are 7+ months ahead of the market -- and really considerably more, perhaps 9+ months to a year, since typically dividend growth portfolios outperform the market. Not a bad start.

You only have a finite time horizon in which to invest so time is indeed money.

--

Game on.


---

Notes:


Wednesday, January 9, 2019

We win again. Dividend Growth Stocks from "Investing in Dividend Growth Stocks" beat the market again in 2018.

2018 was a bad year for most U.S. stocks. The stock market, as measured by the S&P 500, returned -4.38 percent for the year. The typical fund did much worse. According to the January 7, 2019 edition of the Wall Street Journal, "the average manager overseeing a diversified U.S.-stock fund saw a total return of minus 7.73% in 2018..."

---

As they are wont to do, dividend growth stocks fared better. VIG, Vanguard's Dividend Appreciation ETF, returned -2.1 percent in 2018.

The portfolio of dividend growth stocks from my book, Investing in Dividend Growth Stocks, typically beats both the Dividend Growth Index and the market. 2018 was no different. In 2018, the portfolio from the print edition of the book returned -1.39 percent, again besting both the market and VIG. The figure below shows that it has beaten the market for each of the last three years.


The longer-term pattern is just as dominant. As the figure below shows, the portfolio from the print edition of the book has beaten the Dividend Growth Index every (full) year since the index's inception in April, 2006. Likewise, the book's portfolio has beaten the market every year over this period except for slightly underperforming in 2014.


So the book portfolio has beaten the Dividend Growth Index for 12 straight years and has beaten the market 11 of the last 12 years, marginally trailing in the one year that it did not (2014). I would venture to guess no more than a handful -- literally -- of professional funds can stake such a claim -- the odds are very low. I remember, years ago, what a big deal magazines and websites were making of a fund manager that had beaten the market 10 then 15 years in a row. This kind of thing is not common, at all.

---

The reason for our long-term consistent outperformance is quite simple: These are good companies that typically do not get outrageously valued. There are ample subtleties in this simple statement, of course, and that is the rub.

The trick is to have a sound dividend growth strategy, a sound dividend growth model! For instance, many investors in the naughts thought banking stocks were all the rage because they kept consistently raising their dividends -- they completely ignored the high and rising leverage inherent in these companies, as one self-evident and obvious mistake. As one of many examples, Lehman was raising its dividend at a 25 percent a year clip for several years. Meanwhile, and comically ignored by many, its leverage kept rising as well. We all know what happened to Lehman and many other banking stocks -- Lehman went kaput and many banking stocks are still in the doghouse -- with no real dividends to speak of. Likewise, many investors choose utilities as dividend growth stocks. That too is incorrect. You need growth. These fellows don't have it. Dividend and dividend growth investors ignore share buybacks. You simply cannot do that as well. And on and on it goes. These are logical mistakes that damage your returns.

---

Any old dividend growth "strategy" will not work. Most of what you read, even in published and putatively well-regarded books, is incorrect. The underlying theory must be logically sound. At the very least, it must be consistent and complete. Where's the Beef?

---

Notes:

The S&P 500 returned -4.38 percent in 2018. Many websites and publications quote a different value, very often, -6.2 percent. That value is incorrect. http://www.neocadence.com/2019/01/land-of-confusion-what-did-market.html

Performance page for VIG, the Vanguard Dividend Appreciation ETF, https://investor.vanguard.com/etf/profile/performance/vig

Bill Miller was the mutual fund manager who beat the market for 15 years in a row. He was a star for many years -- though he took big risks to generate these returns, risks that were unappreciated by many writers -- and he did struggle for a while later on. An old book about him, The Man Who Beats the S&P, https://www.amazon.com/Man-Who-Beats-Investing-Miller/dp/0471054909

A 2008 article on Bill Miller's subsequent troubles, also highlighting the riskiness of his strategy, https://www.wsj.com/articles/SB122886123425292617


Tuesday, January 19, 2016

How dividend growth stocks outperform the market

The following graph plots the weekly returns of the market versus VIG (Yahoo! Finance), the dividend growth ETF from Vanguard, which I use as a proxy for dividend growth stocks:


The graph shows that dividend growth stocks have a higher peak than the market and the distribution of weekly returns "spreads" less, that is, the distribution has a lower standard deviation, and is therefore less risky (Wikipedia). With dividend growth stocks, probability is concentrated in the center -- with a much smaller left tail and a smaller right tail than the market. Thus, dividend growth stocks do not suffer from collapses and manias nearly as much as the market -- especially with regard to collapses -- and their outperformance during bear markets more than makes up for their somewhat muted performance during bull markets. Net, they march silently up and to the right.


The following statistics compare dividend growth and the market:

Dividend Growth Market Difference
Mean 0.14 0.11 0.03
Standard Deviation 2.26 2.61 -0.34
Quantiles: 0% -15.76 -18.20 2.44
25% -0.95 -1.06 0.11
50% 0.29 0.22 0.07
75% 1.41 1.42 0.00
100% 10.42 12.03 -1.60


As unquestionable positives, dividend growth stocks have:

  • a higher mean than the market,
  • a lower standard deviation,
  • a higher median, and
  • a shorter left-tail.

In exchange, what dividend growth stocks give up is:
  • a shorter right-tail.

The following plots show the spread of returns in another way. The line within the boxes is the median, the lower border the 25th percentile, the upper border the 75th percentile. The first plot compares the full pattern of returns (extreme returns show up as gray points though you have to look closely to spot the gray dots -- they also appear as duplicates, though this is not relevant here, and I ignore this):


The second plot zooms in on the left tail. Importantly, dividend growth stocks perform quite a bit better than the market in the left tail --  these are weekly returns so the 0.11 difference, as shown in the table above, is material. These stocks do not collapse nearly as much as the market when the nasty times arrive. In my opinion, this relative outperformance is one of the key reasons long-term investors should invest in dividend growth stocks.


The third plot zooms in on the right tail. Importantly, dividend growth stocks perform just slightly weaker than the market in the right tail --  the difference is just 0.01:


Thus, dividend growth stocks underperform during bull markets (but not by much, in general) and outperform during bear markets (by a lot). This combination helps ensure good risk-adjusted long-term returns and explains how dividend growth stocks outperform the market.


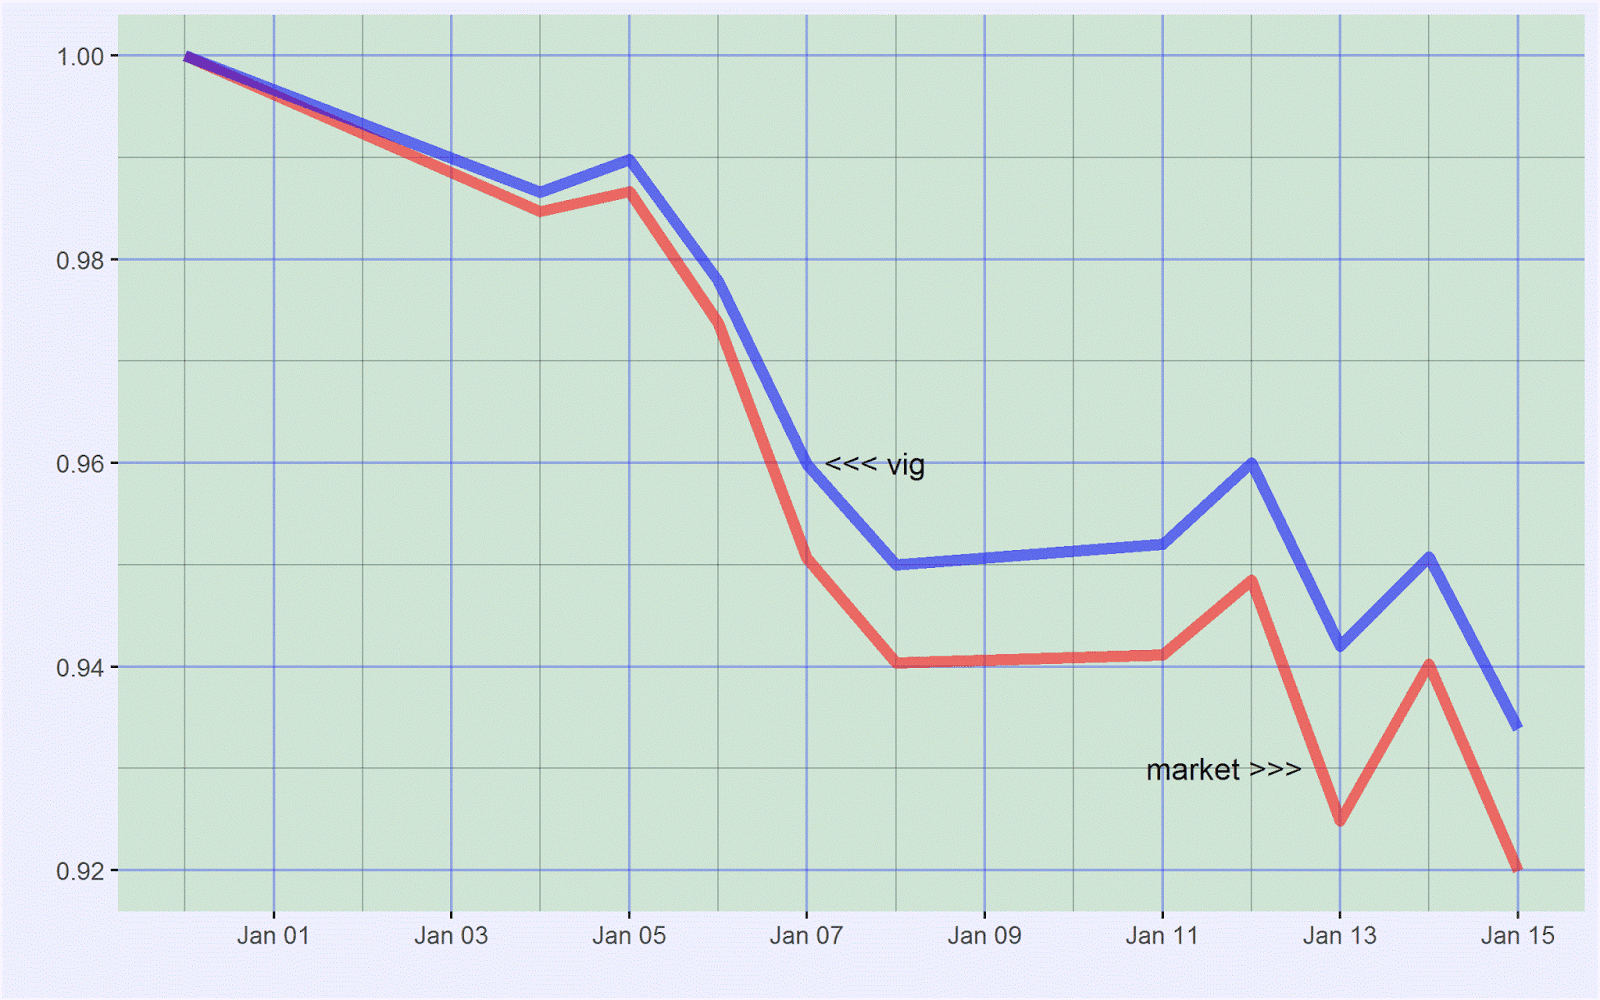
As far as the current (early 2016) market malaise goes, not surprisingly, dividend growth stocks are outperforming the market. Admittedly, they are getting hit but these are high-quality companies and they are not getting hit nearly as much as many other segments of the market, or the market itself:


An important tenet of Investing in Dividend Growth Stocks (Amazon) is that dividend growth stocks are core holdings because they generate good long-term risk-adjusted returns. They do so through a combination of moderate returns and relatively low volatility. Quoting from page 20:


"[A] portfolio [of dividend growth stocks] rises less than the market during bull markets and falls less than the market during bear markets. The latter more than makes up for the former. These stocks march to the beat of a different drummer -- but a very sensible one."


In my opinion, these stocks are excellent long-term investments (subject to not paying too much, as always, of course) for anyone who wants to preserve and build their wealth.


These are not gimmicky companies or slow-growth companies or risky companies. These are companies that last. They grow moderately over long periods, which when combined with relatively low return volatility results in strong gains in long-term wealth.

Friday, December 28, 2012

Long-Term Dividend Growth

In spite of the economy's ups and downs, long-term dividend growers have continued to raise their dividends at a high and stable pace well ahead of the rate of inflation. Johnson & Johnson is on a streak of forty-nine years of consecutive dividend raises.

But be aware that even if companies raise their dividends every year, it is not enough. The dividend increases must be robust. This is not a problem with Johnson & Johnson. The company has excelled.

Over the forty-nine years, its dividend growth rate has averaged fifteen percent. That doubles the dividends that you receive every five years. In the context of average long-term inflation of around 3-3.5 percent, even the company's lowest dividend growth rate of four percent (in 1972) is still not bad.

However, in a sign of maturation or a reflection of its recent business blunders, or both, the company's dividend growth rate has slowed the last few years. Whether this is a permanent change or a pause remains to be seen.

Johnson & Johnson's dividend history since 1972, from the company's website.

Tuesday, December 25, 2012

Averages are better

All financial metrics should be averaged. Just because a stock has a profit margin of twenty-five percent this year does not mean it will have a profit margin of twenty-five percent the next year. An average clarifies the true trend. Averages should be calculated over a period relevant to your investing time frame. For dividend growth investors, this means a five-year average. Watch out for trends. Be wary of negative trends.

Monday, December 24, 2012

Alcoa and Coca-Cola

An investor who received $1,000 in dividends from Alcoa in 2000 received $240 in 2011. Houston, we have a problem. By contrast, an investor who collected $1,000 in dividends from Coca-Cola in 2000 collected $2,765 in 2011. That's dividend growth.