Pages

Showing posts with label trading. Show all posts

Thursday, January 21, 2016

Why weekly up-moves are likelier than daily up-moves

Historically, the probability of an up-day in the market is about 54 percent and the probability of an up-week is somewhat higher. In fact, as long as the probability of an up-day is over 50%, the probability of an up-week is also over 50% -- and the probability of an up-week exceeds the probability of the up-day, whatever it is.

To do so, I make one important simplification, for now: I assume the market closes up for the week if it closes higher on more days than it closes lower. (Regarding unchanged closes, just consider down to include these). In other words, I assume the market closes up for the week if it closes higher three or more of the five trading days in a week. Of course, this is not necessarily true as, for instance, one big up-day can make up for four down-days, but for now I will stick with this simplification -- I do not want to assume a particular distribution for the underlying distribution of returns. I leave the more complex stuff for later.

Thus, our problem reduces to the following: Out of the five trading days in a week what is the probability that the market closes higher three, four, or five days of the week. If p denotes the probability of the market finishing higher on a day, (1-p) is the probability that the market finishes lower. You can think of each day as the toss of a coin -- and all five days as a sequence of five coin tosses. The totality of probabilities is then given by the various terms in the expansion of the binomial formula when n is 5:

\[
\left(p+\left(1-p\right)\right)^{5}=\sum_{i=0}^{5}\binom{5}{i}p^{i}\left(1-p\right)^{5-i}
\]

Our answer is simply the sum of last three terms of this expression. Thus, in reverse order,

\[
p^{5}+5p^{4}(1-p)+10p^{3}(1-p)^{2}
\]


The trick now is to establish that this expression is greater than p. If so, we have shown what we had intended, that weekly market gains happen more often than daily market gains. In the following plot, the blue curve represents the function, the probability of an up-week, the green line, p, the probability of an up-day:


As you can see, the blue curve exceeds the green line -- it is above the green line -- when p is between 0.5 and 1.0.

The following graph makes this clearer. It is a straightforward modification of the above, simply taking the difference between the probability of an up-week and the probability of an up-day and plotting this against the probability of an up-day:


As before, when the daily up-probability is between 0.5 and 1.0, the difference between weekly and daily up-probabilities is positive, meaning the probability of an up-week exceeds the probability of an up-day. In the real world, p needs to typically average above 0.5, long term, or else the market is doing nothing or destroying wealth. (I guess theoretically this could happen, but it has not and generally should not happen in more established markets.) Thus, as p is typically more than 0.5, we have proved our assertion: weekly market gains happen more often than daily market gains. (As an aside, in the graph, when p is between 0.5 and 1.0, the maximum difference is achieved when p is 0.76.)

Let us see how our expression meshes with the historical data noted earlier. From an earlier post, we saw that the probability that the stock market closes higher on any given day is (only) 53.7%. Thus, p = 0.54 (rounded to 2 significant digits). Using this value of p in our expression, we get that the market finishing higher during the week is 0.57, or 57%, in agreement, essentially, with our result from a previous post that the S&P 500 encounters an up-week 56.5 percent of the time.*

Kind of spooky cool, though probably a fair bit lucky.

* [Updated:] I reran the calculations based on a set of daily returns that essentially matches the years (1950 through 2015, roughly) under consideration for the weekly returns. In this case, p is 0.53, and I get that the market finishing higher during the week is 0.56, or 56%, again close enough to the result from the previous post about weekly returns.

Wednesday, January 13, 2016

2016's week 1 return among the 50 worst since 1950

The following plot shows the 50 worst weekly returns of the S&P 500 since 1950 (data from Yahoo! Finance):


The first week of 2016, highlighted in the upper right, is bad -- but not the worst. The worst is the 18.2 percent loss for the week ending October 10. If you recall that amusing period, within a week, Warren Buffett wrote "Buy American, I Am," http://www.nytimes.com/2008/10/17/opinion/17buffett.html, where he advocated being greedy during periods when others are fearful:

"Be fearful when others are greedy, and be greedy when others are fearful. And most certainly, fear is now widespread, gripping even seasoned investors."

Fear is not quite as widespread now as it was then but this thumping has likely taken quite a few investors back to the days of Fall 2008's halcyon panic. Undoubtedly, the market looks awful now -- and the carnage has started to become indiscriminate. A number of decent stocks have been hit, based entirely (most likely) on margin calls, stocks that will nevertheless report excellent numbers in the quarters ahead.

This table shows that the first week of 2016 -- with a weekly return of -5.96% -- is 32nd on the list of worst weekly returns since 1950:


Based on the full set of data, the chance of getting such a bad week (a weekly return of roughly -5% or worse) is roughly 15 out of 1,000 or roughly 1 out of 70 or roughly one week every 16 months. The market did not encounter any such weeks during 2012, 2013, and 2014. In 2015, it encountered one - the week ending 08/21/2015. That week, which saw a loss of -5.77%, is 36th on the list.

Perhaps we are due. Buckle up? Typically, these things do tend to occur in clusters:


This pattern shows clustering -- a tendency for movements to occur close to each other. Certainly, the movements are not random, in the sense that they occur somewhat regularly but without any discerning pattern. This is very different from movements about the mean or 0 -- which do show randomness. For instance, in an earlier post, we saw that randomness is characteristic of monthly returns about 0. Sharp falls have a separate nature unto themselves. They occur relatively rarely and they tend to cluster. Of course, predicting the first is next to impossible. Once you have the first, however, you can be reasonably sure of one or two others upcoming. Maybe.

In my book, Investing in Dividend Growth Stocks, I emphasize stability of returns for long-term investors precisely because I am not a fan of extreme movements for the typical long-term holder of any stock (you have no choice if you hold the market, which I am also not a huge fan of, but that story is for another day). Moreover, it is not difficult to show that if you have stability in your returns you tend to have a higher compounded return (read: wealth), all else equal. When you invest in unstable stocks and many markets you have to be certain not to get continually hammered as your long-term returns will invariably suffer. With generally stable markets such as the U.S. market, this "suffering" is not nearly as great as it is with many other markets. Essentially, this has to do with excess volatility acting like a leech, bleeding off your compounded return, hence wealth. From my book:

"If you had to choose between (a) two years of returns at 10 percent a year and (b) a first-year return of 0 percent a year followed by a second-year return of 20 percent a year, which would you choose? Although the average of both choices is 10 percent a year (the average of two tens is 10 and the average of 0 and 20 is 10), the stable growth of the first choice results in more wealth. With the first choice, for every $100 that you invest, you end up with $121; with the second choice, for every $100 that you invest, you end up with $120. Yes, all of $1 less; but what counts is the general principle: For a given average return, where the average is computed simply as the sum of the annual returns divided by the number of years, stable growth is always more valuable than fluctuating growth."

For more, see pages 76-81 of my book. If you do not have the book, you may be able to view the pages on Amazon if you use Amazon's look-inside feature for the book, here.

Sunday, January 3, 2016

The randomness of monthly returns and the Lake Wobegon effect

More than 70% of U.S. drivers believe they are better-than-average drivers, an example of the Lake Wobegon effect, https://en.wikipedia.org/wiki/Lake_Wobegon#The_Lake_Wobegon_effect.

Likewise, a higher than expected number of investors probably believe they are better-than-average investors. Essentially, in the stock market, this means they can spot patterns. For instance, they believe they can pick the perfect stock. They believe they know when to buy and when to sell. They believe they know when to exit the market. Most of this is hindsight bias as well -- investors looking at the past and saying they would have bought this or that at the right time and sold this or that at the right time. I am not saying it is not possible but it isn't easy. Some may certainly know how -- but it is likely very few.

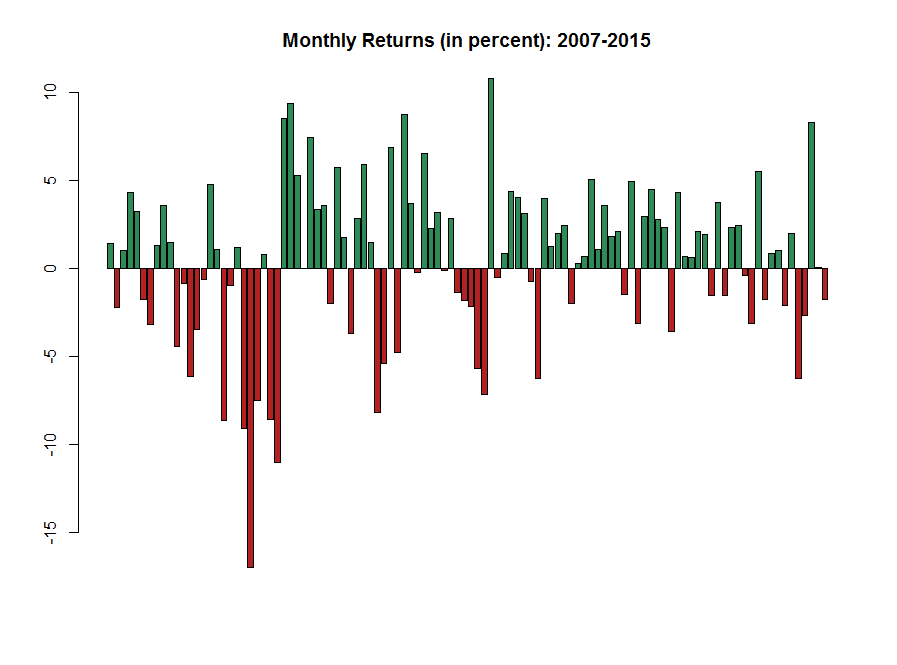
The following chart shows the monthly returns (in percent) for the S&P 500, price only, between 2007 and 2015:


I took the returns and simply characterized them as up or down in the following chart:


Perhaps there are patterns here and maybe some say they are obvious. But are they? I used a statistical test called a runs test to check the randomness of the pattern. When I ran the test, I got a result that indicated the pattern was very likely random. In turn, this means monthly returns are very likely random. (In statistical jargon, I get a p-value of 0.8782. Generally, for this test, a p-value below 0.05 suggests a lack of randomness. Here, the p-value is significantly larger than 0.05 -- thus suggesting randomness.) 

If the result of a game is random, it is difficult to play the game many, many times and finish significantly above average -- regardless of what we think of our abilities. Sometimes we get it right. At other times, we get it wrong. Few of us get it consistently right -- and that too is explainable mostly as luck. Think of it this way: You, or I -- or even the residents of Lake Wobegon -- cannot consistently call the next flip of a coin.

Friday, December 12, 2014

What is the probability that the stock market closes higher on any given day?

The punch line: The probability that the stock market closes higher on any given day is (only) 53.7%. That's it. Better than flipping a coin, but not by much. The rest of the time it finishes lower (45.2% of the time) or unchanged (1.1%). Yet, because of compounding, this is all that it takes to produce a trend -- and a strong uptrend -- over time.*

---

On any given day will the stock market rise or fall? I used daily adjusted closing price data from Yahoo! Finance for SPY, the S&P 500 ETF to find out. The data span 01/29/1993 to 12/11/2014. Here is a bar chart with results grouped by year:


---

The bar chart is not zeroed on the y-axis and is scaled to make the differences apparent. The probability of up days spans a range of 47.4% (in 2002) to 59.2% (in 2014). On any given day, the stock market will rise 53.7% of the time (and fall or remain even 46.3% of the time). Your odds of making money are roughly 27:23, or even more roughly, 6:5. That's it. Don't bet the farm. For such a short period as a day, you're essentially tossing a coin.

---

*  I'm almost certain that this phenomenon is similar to why a tiny preference by people for some attribute leads to a clustering of those attributes around a geographic area over time. In other words, what we expect to be a random distribution of attributes over geographic area instead exhibits a clustering effect. Likewise, for us, what we expect to be a random distribution of stock prices over time, instead behaves -- when there's a slight increase in chance -- as a strong trend of gradually rising prices.

Monday, February 18, 2013

16-year-old day trader, Rachel Fox

You know the market is topping when the media puts out stories like these.

16-year old actress, Rachel Fox, placed 338 trades last year. She did well, a 30.4 percent return, but the market did well last year too -- though not as well, around 16 percent. Take out taxes from her return, say a third, because her returns would be taxed hard because of short-term gains, and her return drops precipitously, but still, to be fair, she did quite well. We also do not know if her returns exclude expenses, though I suspect they do.

Nevertheless, this reminds me very much of stories that come out when the market is topping. Remember the truck-drivers planning to buy their own islands during the late 1990's? Bull markets make geniuses of us all. They make geniuses of newbies as well -- Rachel Fox only started trading in November 2011. Either she's incredibly lucky or she's incredibly gifted. I'll reserve judgment and say she's incredibly lucky. She needs to experience a bear market and then a couple more.

---

The market at any given point suits certain personality types best. But few personalities are mutable, few personalities can adapt to the market's ever-changing state. Thus, there will be plenty of occasions when a certain personality type that does well in one type of market loses his or her shirt in a different type of market.

---

Source: http://goo.gl/tYt5W

Wednesday, February 13, 2013

Never confuse a bull market with brains...

Never confuse a bull market with brains. Just because someone does well in a bull market does not mean they will do well over the long term.

Over a decade or two, investing success is far from guaranteed.

Bear markets punish the unwary; strategies that worked well during one bull market become the reason for failure the next; the speculative star of one bull market becomes the pariah the next.

Few recognize the change; even fewer adapt.

Wednesday, January 30, 2013

That perfect moment

Exiting a stock or the stock market is just one part of trading. The other part is knowing when to get back in.

And in many cases when investors get back in they are under-invested. Much of their portfolio sits in cash waiting for just that perfect moment.

Today, many individual investors are rushing into stocks just as the market is approaching new long-term highs. Where have these investors been?

Chances are very high that their returns are significantly less than what they would have been had they been fully invested throughout.

Sunday, December 30, 2012

Trends and Noise

The short-term ebbs and flows of uncoordinated buying and selling make the market look more or less random. New information can establish a trend but discerning the strength of that trend and how long it will last takes a keen eye -- and the wisdom and insight gleaned from years of experience. Once the trend wears off, the market quickly resumes its random walk.

Wednesday, December 26, 2012

Minutiae of the news

We often get caught up in the minutiae of the news. What happens tomorrow because of such-and-such? What happens if Candidate X is elected? What happens if the yen strengthens? Doing so could easily make you a 24-hour business news junkie, fidgeting for this or that, trading much too often -- and much too recklessly. Just because it's cheap to trade does not mean that you have to trade.