Pages

Showing posts with label investing in dividend growth stocks. Show all posts

Sunday, December 1, 2024

Google is killing goo.gl... LOL

In my books, I used Google's URL shortener to shorten URLs. I felt that since Google was such a large company, the shortened URLs would not go the way of the Dodo. Well, fast forward a few years and the world realizes Google is in the habit of killing things 😂 -- according to the company, sometime in August 2025, Google shortened URLs will NOT work. That's more than annoying.

Here are the full URLs for the shortened URLs in the books (IDGS is Investing in Dividend Growth Stocks, DGW is Dividend Growth Whisperer). With IDGS, some of these URLs are in the kindle edition, an extended and separate edition of the book, but not in the print edition -- or they have changed between editions. In the list below, the first link or set of links is/are the shortened URL(s); the second link or set of links is/are the full URL(s).

(When you realize the extent of some of these unshortened links, you'll see why I had to shorten them. If I had used the full links, no-one in their right mind would have used them.😂)

(In the list below, the Google Finance Stock Screener is dead -- Google removed it in 2022. So, boys and girls, here we have yet another example of Google killing things. 😂)


Primary Links:

(IDGS)
Download a copy of the spreadsheet (three links but essentially the same):
http://goo.gl/qSTFJR
or
https://goo.gl/r5dMVH
or
https://goo.gl/Eo9gTj

(To download a copy of the spreadsheet use the "View the spreadsheet" link shown next and click File then Download then Microsoft Excel (.xlsx) from the menu.)

(IDGS)
View the spreadsheet  (three links but essentially the same):
http://goo.gl/etw143
or
https://goo.gl/coVfXe
or
https://goo.gl/9kWaVm

or


(IDGS) (DGW)
Finviz dividend growth screen:
https://goo.gl/qZVOUM


Secondary Links:

(IDGS)
SEC Edgar:
(dead) http://goo.gl/1iUiL

(IDGS) (DGW)
Search SEC filings:
https://goo.gl/bKxLAo

(IDGS)
Johnson & Johnson investor relations website:
(dead) https://goo.gl/zY2TK

(IDGS) (DGW)
Finviz Stock Screener:
https://goo.gl/c9UnZ

(IDGS)
Google Finance Stock Screener:
(dead) https://goo.gl/30YZ2

(IDGS)
Ross Stores Chart:
http://goo.gl/wmmnjL

(DGW)
Berkshire Hathaway 1996 Chairman's Letter:
https://goo.gl/3wrC7K

(DGW)
Paying Back your Shareholders by McKinsey:
https://goo.gl/v8fWws

(DGW)
The repurchase revolution by the Economist:
https://goo.gl/eDnvAB

(DGW)
Zacks Stock Screener:
https://goo.gl/9gr676

(DGW)
VDAIX: 
https://goo.gl/jvElCl

(DGW)
VIG:
https://goo.gl/nkvKB8

(DGW)
FRDPX:
(dead) https://goo.gl/XmZARQ

(DGW)
PRDGX:
(dead) https://goo.gl/FtZI7r

(DGW)
Dividend Aristocrats:
(dead) https://goo.gl/GzujEl

(DGW)
NASDAQ US Dividend Achievers Select Index:
https://goo.gl/Ka67fs

(DGW)
A criticism of beta:
(changed) https://goo.gl/1wZoVs

(DGW)
McCormick investor relations website:
(dead) https://goo.gl/XdQN41

(DGW)
Sample Value Line report:
(dead) https://goo.gl/x2y721
(see the sample in the "How to read a Value Line research report" link next)

(DGW)
How to read a Value Line research report:
(dead) https://goo.gl/m0rR5X

(DGW)
Nike Selected Financial Data:
https://goo.gl/HNyVdm

(DGW)
Texas Instruments, on their capital management strategy:
(dead) https://goo.gl/hUFzgT

(DGW)
Total returns for the S&P 500: 
https://goo.gl/Y4g1aj

(DGW)
Bull market's rise since the bottom on March 9, 2009:
https://goo.gl/kPnX7z

(DGW)
P/Es and dividend yields on major indexes, from the Wall Street Journal:
https://goo.gl/G5TwAC

(DGW)
S&P 500 factsheet with P/E ratios, both trailing and projected:
(dead) https://goo.gl/bZrdnM

(DGW)
Portfolio characteristics of the Vanguard Dividend Appreciation ETF:
https://goo.gl/L6aWT3


Tertiary Links:

(IDGS)
Length of 2013's U.S. Federal Tax Code:
https://goo.gl/YFKQEL

(IDGS)
Buffett's 1980 letter to shareholders:
https://goo.gl/nEJHGd

(IDGS)
LEGO facts:
(dead) https://goo.gl/mgrDcG

(IDGS)
The Legend of the Chessboard (Teaser):
https://goo.gl/DYxtbJ

(DGW)
Washington Post article on the last Blockbuster in America:
https://goo.gl/49WiWg

(DGW)
Enron:
https://goo.gl/r5q1Lk

(DGW)
Kenneth Lay:
https://goo.gl/lOQr9P

(DGW)
Jeffrey Skilling:
https://goo.gl/8y8YfL

(DGW)
Andrew Fastow:
https://goo.gl/P6JVMI

(DGW)
More on the interest deduction in the Tax Code:
https://goo.gl/Xegm3x

Wednesday, January 23, 2019

Odds of beating the market over many years -- continued

An earlier post shows just how difficult it is to beat the market over many years.

For instance, with a 45 percent chance of beating the market over one year, the probability of beating the market 9 or more years out of 12 is small -- just 36 times out of 1,000, or 3.6 percent (add the probabilities for 9, 10, 11, and 12 years in the figure below). And beating the market 11 or more years out of 12 is truly comically tiny -- just 11 times out of 10,000, or 0.11 percent.


---

You may object to my 45 percent assumption, but this is roughly the (optimistic) probability of a mutual fund beating the market in a given year. Here's some proof.

In the 1996 edition of Burton Malkiel's exceptional book, "A Random Walk Down Wall Street," he states:

"Over the whole 22-year period since the first edition of this book, about two-thirds of the funds proved inferior to the market as a whole. [Thus the probability of beating the market (or equaling it) is about 33 percent. To be fair, I am not entirely sure whether this is per year. Nor am I sure of the type of return calculation.]"

However a nearby graph in his book gives plenty of detail. In the graph, Malkiel shows the probabilities of the broad market beating the typical general equity fund for each of the last 22 years. Averaging the values over the 22 years, 1973 through 1994, I get a 56.6 percent probability of the market beating the funds each year or a 43.4 percent of the typical general equity fund beating (or equaling) the market each year.

Thus, the 45 percent assumption is not silly.

---

In fact, as the markets have become more efficient, I suspect this 45 percent assumption gives fund managers ample benefit of the doubt. For instance, you will often read that only 25 percent, or so, funds beat the market in the current year.

---

I do not know the statistics for the individual investor but I suspect 45 percent is being quite generous. In fact, typical investor performances in mutual funds have badly trailed the already shoddy performance of the funds. In other words, the typical investor underperforms the typical mutual fund -- most likely because of the usual culprits, namely, greed and panic asserting themselves at precisely the wrong times.

---

Finally, one last point. Some may argue it is the total compound return that matters over many years not how many times someone beats the market. That is certainly true but just remember generating 40 percent one year, far above the market (say), usually implies weak returns the next few years. And because of how investors behave, jumping in at the tail end of the 40 percent, then holding the fund for the next few years, net, they get killed.

Ideally, what you want is consistent returns just above market with moderate risk. Do that and you make a killing.

---

So the next time someone tells you they beat the market, ask them how many times they have beaten the market over a long period. Only then will you get the honest truth -- in my opinion, 70 or 75 percent of the time over a long period is evidence of an extremely strong strategy and performance.

This isn't easy.

---


Notes:

The portfolio in "Investing in Dividend Growth Stocks" has beaten the market 11 times out of the last 12, and really 12 times out of the last 13 years, or 92 percent, a record that is matched by no more than a few, if any, (general purpose) mutual funds over this period. Available on Amazon, https://www.amazon.com/Investing-Dividend-Growth-Stocks-Realistic-ebook/dp/B01N30M6DR/ref=sr_1_4?ie=UTF8&qid=1548278535&sr=8-4&keywords=dividend+growth+stocks and https://www.amazon.com/Investing-Dividend-Growth-Stocks-Realistic/dp/0982287003/ref=sr_1_7?ie=UTF8&qid=1548278535&sr=8-7&keywords=dividend+growth+stocks

The portfolio in "Dividend Growth Whisperer," published in October, 2018, handily hammered the market in the fourth quarter of 2018. The portfolio in this book is an update to the portfolio in "Investing in Dividend Growth Stocks." It also presents a novel (and simpler) variation of the crucial concept of valuation. Available on Amazon, https://www.amazon.com/Dividend-Growth-Whisperer-Understanding-Investment-ebook/dp/B07JMMTM4R/ref=tmm_kin_swatch_0?_encoding=UTF8&qid=1548278590&sr=8-1

The latest edition of "A Random Walk Down Wall Street," https://www.amazon.com/Random-Walk-Down-Wall-Street/dp/1324002182/ref=sr_1_1?ie=UTF8&qid=1548277918&sr=8-1&keywords=a+random+walk+down+wall+street

Wednesday, January 9, 2019

We win again. Dividend Growth Stocks from "Investing in Dividend Growth Stocks" beat the market again in 2018.

2018 was a bad year for most U.S. stocks. The stock market, as measured by the S&P 500, returned -4.38 percent for the year. The typical fund did much worse. According to the January 7, 2019 edition of the Wall Street Journal, "the average manager overseeing a diversified U.S.-stock fund saw a total return of minus 7.73% in 2018..."

---

As they are wont to do, dividend growth stocks fared better. VIG, Vanguard's Dividend Appreciation ETF, returned -2.1 percent in 2018.

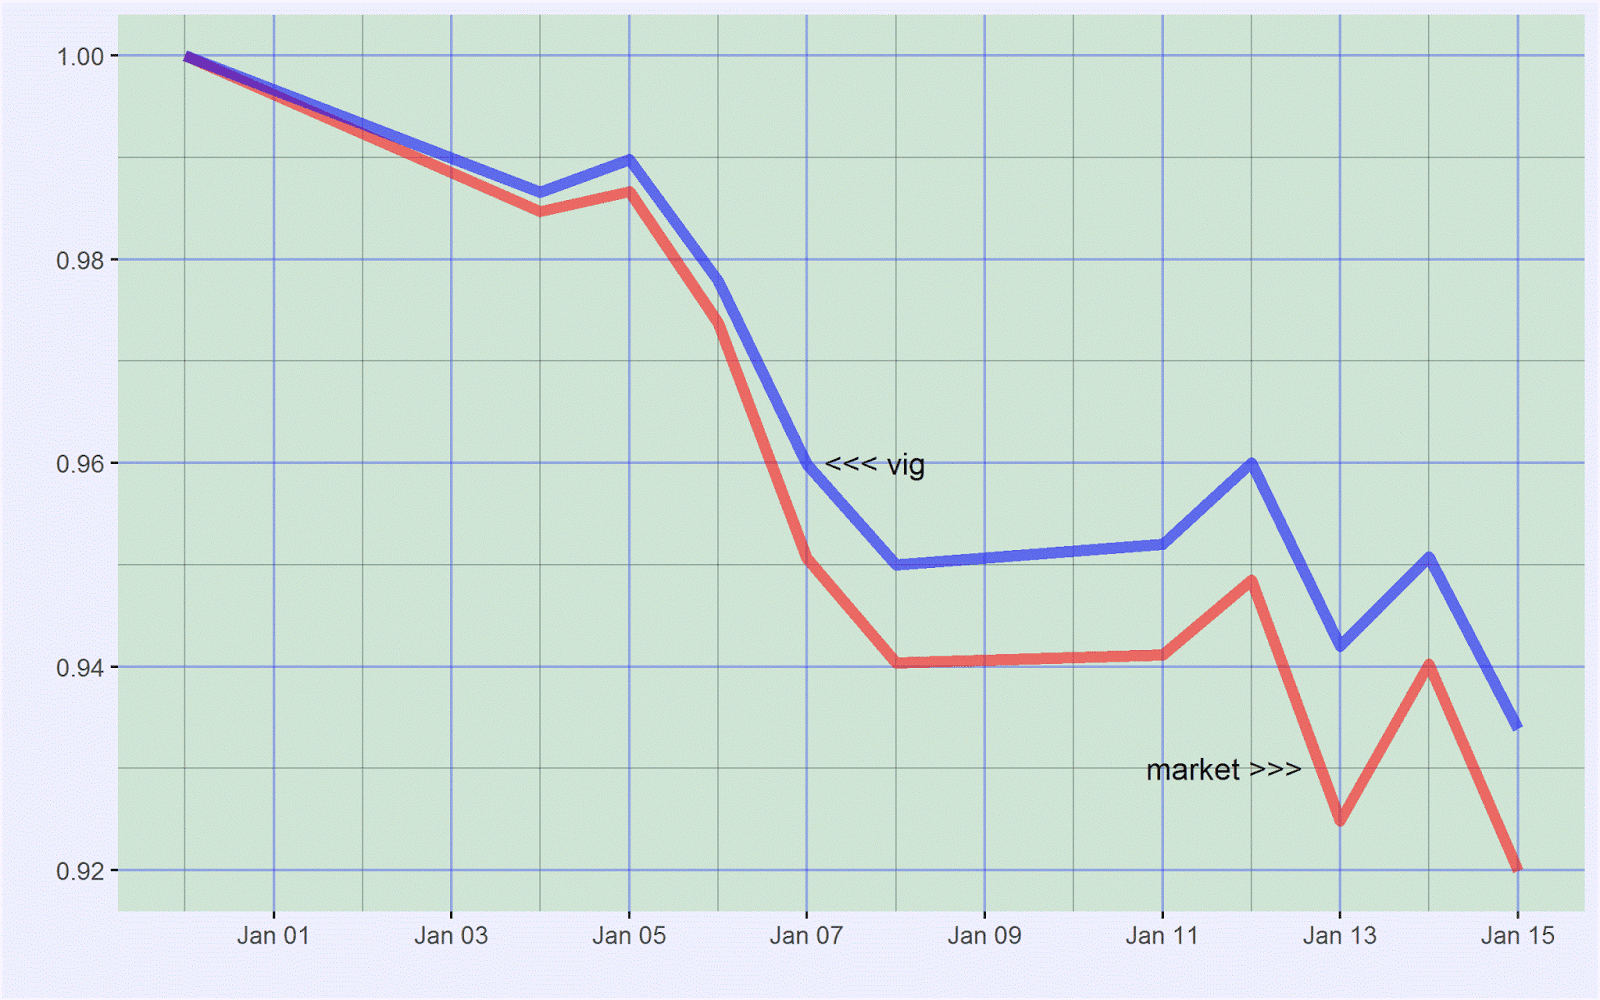
The portfolio of dividend growth stocks from my book, Investing in Dividend Growth Stocks, typically beats both the Dividend Growth Index and the market. 2018 was no different. In 2018, the portfolio from the print edition of the book returned -1.39 percent, again besting both the market and VIG. The figure below shows that it has beaten the market for each of the last three years.


The longer-term pattern is just as dominant. As the figure below shows, the portfolio from the print edition of the book has beaten the Dividend Growth Index every (full) year since the index's inception in April, 2006. Likewise, the book's portfolio has beaten the market every year over this period except for slightly underperforming in 2014.


So the book portfolio has beaten the Dividend Growth Index for 12 straight years and has beaten the market 11 of the last 12 years, marginally trailing in the one year that it did not (2014). I would venture to guess no more than a handful -- literally -- of professional funds can stake such a claim -- the odds are very low. I remember, years ago, what a big deal magazines and websites were making of a fund manager that had beaten the market 10 then 15 years in a row. This kind of thing is not common, at all.

---

The reason for our long-term consistent outperformance is quite simple: These are good companies that typically do not get outrageously valued. There are ample subtleties in this simple statement, of course, and that is the rub.

The trick is to have a sound dividend growth strategy, a sound dividend growth model! For instance, many investors in the naughts thought banking stocks were all the rage because they kept consistently raising their dividends -- they completely ignored the high and rising leverage inherent in these companies, as one self-evident and obvious mistake. As one of many examples, Lehman was raising its dividend at a 25 percent a year clip for several years. Meanwhile, and comically ignored by many, its leverage kept rising as well. We all know what happened to Lehman and many other banking stocks -- Lehman went kaput and many banking stocks are still in the doghouse -- with no real dividends to speak of. Likewise, many investors choose utilities as dividend growth stocks. That too is incorrect. You need growth. These fellows don't have it. Dividend and dividend growth investors ignore share buybacks. You simply cannot do that as well. And on and on it goes. These are logical mistakes that damage your returns.

---

Any old dividend growth "strategy" will not work. Most of what you read, even in published and putatively well-regarded books, is incorrect. The underlying theory must be logically sound. At the very least, it must be consistent and complete. Where's the Beef?

---

Notes:

The S&P 500 returned -4.38 percent in 2018. Many websites and publications quote a different value, very often, -6.2 percent. That value is incorrect. http://www.neocadence.com/2019/01/land-of-confusion-what-did-market.html

Performance page for VIG, the Vanguard Dividend Appreciation ETF, https://investor.vanguard.com/etf/profile/performance/vig

Bill Miller was the mutual fund manager who beat the market for 15 years in a row. He was a star for many years -- though he took big risks to generate these returns, risks that were unappreciated by many writers -- and he did struggle for a while later on. An old book about him, The Man Who Beats the S&P, https://www.amazon.com/Man-Who-Beats-Investing-Miller/dp/0471054909

A 2008 article on Bill Miller's subsequent troubles, also highlighting the riskiness of his strategy, https://www.wsj.com/articles/SB122886123425292617


Wednesday, January 27, 2016

Valuing Chipotle

Ticker: CMG

Sector: Consumer Discretionary

Size: Large-cap

Website: http://www.chipotle.com


A "messy" recent history: In the last few months, Chipotle has had a bad case of burrito indigestion (chipotle.com). Five incidents of outbreaks have been reported (WSJ):

"Since July, there have been a total of five outbreaks linked to Chipotle, including a little-reported case of E. coli that sickened five people in Seattle and which was a different strain unrelated to the larger outbreak that began in October, as well as a norovirus case in Southern California, a salmonella outbreak in Minnesota and the Boston [norovirus] outbreak."

From a close of $720 in September 2015, the stock closed at $448 yesterday, a fall of 38 percent. Its stock chart is a mess -- though the downward momentum of the fourth quarter of 2015 seems to have abated:


Not surprisingly, analysts have ratcheted down their earnings per share estimates sharply. For the fourth quarter of 2015, estimates have fallen 57 percent from $4.37, ninety days ago, to $1.86 today. For 2016, estimates have fallen 37 percent from $20.46, ninety days ago, to $12.86 today (Yahoo! Finance).

In terms of earnings per share, roughly, 2016 represents a setback of 2.5 years.


General Analysis: Chipotle is a high-growth stock, a class of stocks notoriously difficult to value because high growth tends to be unstable. With Chipotle, however, growth is stable, making it easy to value. In this post, I follow the guidelines and format in Twenty dividend growth stocks to consider in Investing in Dividend Growth Stocks (pages 219 - 272) (Amazon). Chipotle is not a dividend growth stock -- it does not pay a dividend -- but its underlying business stability makes it, with one tweak for two scenarios, similar to value. I use Chipotle's results from 2010 through 2014 to unearth the underlying characteristics of the business. Incorporating a messy 2015 would distort the analysis.


The Business: Chipotle sells burritos, tacos, burrito bowls, and salads -- "a few things, thousands of ways" -- at its more than 1,900 fast casual restaurants, primarily in the U.S. The company also operates a much smaller chain of 11 Southeast Asian Kitchen restaurants and invests in an entity that operates 3 Pizzeria Locale restaurants. The company's by-line is "food with integrity." Its grander aim is to change "the way people think about and eat fast food."


Risks: After the outbreaks, will consumers return? According to the company, same restaurant sales fell about 15 percent in the fourth quarter of 2015 (Bloomberg). Nevertheless, I believe consumers will eventually return. With good, honest companies, the underlying business eventually recovers. In the 1980s, Johnson & Johnson had the Tylenol scare. They fixed it. Consumers returned. A few years ago, Johnson & Johnson had problems with manufacturing. They fixed it. Consumers returned. Where there is value -- and integrity -- in the brand, as with Johnson & Johnson and Chipotle; and problems are addressed, as Johnson & Johnson did and Chipotle is doing (chipotle.com), consumers do eventually return.

Of the other risks, commodity costs are one. Consumers do visit restaurants less often during recessions -- though Chipotle's relatively inexpensive food may mean it may not see the dramatic declines symptomatic of higher-priced restaurants.

Few other risks, longer term, meaning, in the next 10 or so years.


The Numbers: Profit margins have averaged ten percent the last five years. Asset turnover is 1.6. Chipotle does not have long-term debt -- in the traditional sense. It does, however, disclose deferred rent obligations. Financial leverage is low, 1.3. Return on equity is 22 percent. Likewise, return on equity has averaged 22 percent the last five years. Moreover, because the company has excess cash and investments on its balance sheet, its "true" return on equity is higher.


Dividends and Share Buybacks: The company does not pay a dividend. The company does buy back shares, mostly, it seems, to offset dilution. Over the last five years, the company has retired its shares at a modest 0.4 percent per year clip. (Comparatively, dividend growth stocks typically retire their shares at a much higher rate, but Chipotle is a high-growth stock. In fact, that it even retires its shares is somewhat of a bonus.)


Spreadsheet Parameters: (I use the spreadsheet described in Investing in Dividend Growth Stocks (Amazon) -- with a slight tweak to adjust for the possibility of a robust recovery in earnings per share -- to value the stock. See pages 158 - 176.) Actual dividend payout ratio of 0 percent; assumed payout ratio of 35 percent. Return on beginning equity: 30 percent. It is currently 29 percent. It has averaged 27 percent the last five years. In fact, because the company has excess cash and investments on its balance sheet, its "true" return on beginning equity is higher -- I am likely conservative with my 30 percent. Earnings growth has averaged an impressive 29 percent the last five years. Few large companies can sustain such high growth rates over long periods and, in that sense, Chipotle is one of the rare ones. Dividend growth: n/a. Earnings per share growth roughly mirrors earnings growth because share buybacks are muted. Chipotle operates more than 1,900 restaurants. The company opens more than 200 net new restaurants a year. It is not unreasonable to assume they can maintain this pace for at least the next several years. I do not believe the market is near saturation. For instance, McDonald's is virtually everywhere in the U.S. -- and McDonald's has 14,300 U.S. restaurants (though they do intend to close a handful this year (New York Times)). Moreover, Chipotle will almost certainly expand outside the U.S. more aggressively at some point and the company is testing a few new restaurant ideas. Reasonable growth rates for our spreadsheet, if sales were to resume their historical growth rates: (Years 1-5: 26 percent) (Years 6-10: 22 percent) (Years 11-20: 16 percent) (Years 21-30: 10 percent) (Years 31+: 3 percent).


Sample Spreadsheet Results: Because earnings per share can vary dramatically the next several quarters, I use four potential scenarios to gauge the scope of variability:

  • (1) Reset -- current depressed earnings per share.
  • (2) Quick Reset -- higher current earnings per share.
  • (3) Reset ++ -- current depressed earnings per share, then full recovery next year.
  • (4) Quick Reset ++ -- higher current earnings per share, then full recovery next year.

Explicitly, I use the following values:

Scenario Stock Price EPS - current P/E ratio - current EPS - next
(1) 450 11 41 13.86
(2) 450 15 30 18.90
(3) 450 11 41 22.55
(4) 450 15 30 22.55

These earnings per share are for periods centered on January 1 -- thus the last 6 months of 2015 plus the first 6 months of 2016 for the current period, for example.

Of course, even within these patterns, we have many other possibilities -- but at least they help establish a range. Using a current stock price of $450, and the spreadsheet described in Investing in Dividend Growth Stocks (Amazon), I get the following results:

Scenario Expected Return
(1) 12.33%
(2) 13.85%
(3) 14.80%
(4) 14.79%

Screenshots from the spreadsheet for scenario (3), also showing the slight tweak in red (also needed in scenario (4)) I made in the Projections section:


These are long-term returns. All are outstanding -- because growth remains deliciously high. If Chipotle produces these gains, investors will be well ahead of the market. That said, none of these results make any sense if growth permanently collapses (YouTube) but I do not believe this happens.

In addition, risk is not low under any of our scenarios -- as the relatively high P/E ratios attest.

As a comparison, if we were to live in a parallel universe (YouTube), with the recent company-specific indigestion nonexistent and Chipotle humming along, at a stock price of (say) $600 (to account for the recent market decline -- the market still declines in the parallel universe) and earnings per share of $19, all other assumptions the same as above, the expected return is 13.59 percent a year -- and, yes, with a P/E ratio of 32, the stock is still not low risk. Blame those high P/E ratios -- even in the parallel universe.


Disclosure: I own a tiny position in Chipotle, entirely for fun. I always order a carnitas burrito. It rocks. Do not interpret this post as a recommendation to buy or sell or trade or whatever, including buying a Chipotle burrito. Always do -- and depend -- on your due diligence.

Tuesday, January 19, 2016

How dividend growth stocks outperform the market

The following graph plots the weekly returns of the market versus VIG (Yahoo! Finance), the dividend growth ETF from Vanguard, which I use as a proxy for dividend growth stocks:


The graph shows that dividend growth stocks have a higher peak than the market and the distribution of weekly returns "spreads" less, that is, the distribution has a lower standard deviation, and is therefore less risky (Wikipedia). With dividend growth stocks, probability is concentrated in the center -- with a much smaller left tail and a smaller right tail than the market. Thus, dividend growth stocks do not suffer from collapses and manias nearly as much as the market -- especially with regard to collapses -- and their outperformance during bear markets more than makes up for their somewhat muted performance during bull markets. Net, they march silently up and to the right.


The following statistics compare dividend growth and the market:

Dividend Growth Market Difference
Mean 0.14 0.11 0.03
Standard Deviation 2.26 2.61 -0.34
Quantiles: 0% -15.76 -18.20 2.44
25% -0.95 -1.06 0.11
50% 0.29 0.22 0.07
75% 1.41 1.42 0.00
100% 10.42 12.03 -1.60


As unquestionable positives, dividend growth stocks have:

  • a higher mean than the market,
  • a lower standard deviation,
  • a higher median, and
  • a shorter left-tail.

In exchange, what dividend growth stocks give up is:
  • a shorter right-tail.

The following plots show the spread of returns in another way. The line within the boxes is the median, the lower border the 25th percentile, the upper border the 75th percentile. The first plot compares the full pattern of returns (extreme returns show up as gray points though you have to look closely to spot the gray dots -- they also appear as duplicates, though this is not relevant here, and I ignore this):


The second plot zooms in on the left tail. Importantly, dividend growth stocks perform quite a bit better than the market in the left tail --  these are weekly returns so the 0.11 difference, as shown in the table above, is material. These stocks do not collapse nearly as much as the market when the nasty times arrive. In my opinion, this relative outperformance is one of the key reasons long-term investors should invest in dividend growth stocks.


The third plot zooms in on the right tail. Importantly, dividend growth stocks perform just slightly weaker than the market in the right tail --  the difference is just 0.01:


Thus, dividend growth stocks underperform during bull markets (but not by much, in general) and outperform during bear markets (by a lot). This combination helps ensure good risk-adjusted long-term returns and explains how dividend growth stocks outperform the market.


As far as the current (early 2016) market malaise goes, not surprisingly, dividend growth stocks are outperforming the market. Admittedly, they are getting hit but these are high-quality companies and they are not getting hit nearly as much as many other segments of the market, or the market itself:


An important tenet of Investing in Dividend Growth Stocks (Amazon) is that dividend growth stocks are core holdings because they generate good long-term risk-adjusted returns. They do so through a combination of moderate returns and relatively low volatility. Quoting from page 20:


"[A] portfolio [of dividend growth stocks] rises less than the market during bull markets and falls less than the market during bear markets. The latter more than makes up for the former. These stocks march to the beat of a different drummer -- but a very sensible one."


In my opinion, these stocks are excellent long-term investments (subject to not paying too much, as always, of course) for anyone who wants to preserve and build their wealth.


These are not gimmicky companies or slow-growth companies or risky companies. These are companies that last. They grow moderately over long periods, which when combined with relatively low return volatility results in strong gains in long-term wealth.

Wednesday, January 13, 2016

2016's week 1 return among the 50 worst since 1950

The following plot shows the 50 worst weekly returns of the S&P 500 since 1950 (data from Yahoo! Finance):


The first week of 2016, highlighted in the upper right, is bad -- but not the worst. The worst is the 18.2 percent loss for the week ending October 10. If you recall that amusing period, within a week, Warren Buffett wrote "Buy American, I Am," http://www.nytimes.com/2008/10/17/opinion/17buffett.html, where he advocated being greedy during periods when others are fearful:

"Be fearful when others are greedy, and be greedy when others are fearful. And most certainly, fear is now widespread, gripping even seasoned investors."

Fear is not quite as widespread now as it was then but this thumping has likely taken quite a few investors back to the days of Fall 2008's halcyon panic. Undoubtedly, the market looks awful now -- and the carnage has started to become indiscriminate. A number of decent stocks have been hit, based entirely (most likely) on margin calls, stocks that will nevertheless report excellent numbers in the quarters ahead.

This table shows that the first week of 2016 -- with a weekly return of -5.96% -- is 32nd on the list of worst weekly returns since 1950:


Based on the full set of data, the chance of getting such a bad week (a weekly return of roughly -5% or worse) is roughly 15 out of 1,000 or roughly 1 out of 70 or roughly one week every 16 months. The market did not encounter any such weeks during 2012, 2013, and 2014. In 2015, it encountered one - the week ending 08/21/2015. That week, which saw a loss of -5.77%, is 36th on the list.

Perhaps we are due. Buckle up? Typically, these things do tend to occur in clusters:


This pattern shows clustering -- a tendency for movements to occur close to each other. Certainly, the movements are not random, in the sense that they occur somewhat regularly but without any discerning pattern. This is very different from movements about the mean or 0 -- which do show randomness. For instance, in an earlier post, we saw that randomness is characteristic of monthly returns about 0. Sharp falls have a separate nature unto themselves. They occur relatively rarely and they tend to cluster. Of course, predicting the first is next to impossible. Once you have the first, however, you can be reasonably sure of one or two others upcoming. Maybe.

In my book, Investing in Dividend Growth Stocks, I emphasize stability of returns for long-term investors precisely because I am not a fan of extreme movements for the typical long-term holder of any stock (you have no choice if you hold the market, which I am also not a huge fan of, but that story is for another day). Moreover, it is not difficult to show that if you have stability in your returns you tend to have a higher compounded return (read: wealth), all else equal. When you invest in unstable stocks and many markets you have to be certain not to get continually hammered as your long-term returns will invariably suffer. With generally stable markets such as the U.S. market, this "suffering" is not nearly as great as it is with many other markets. Essentially, this has to do with excess volatility acting like a leech, bleeding off your compounded return, hence wealth. From my book:

"If you had to choose between (a) two years of returns at 10 percent a year and (b) a first-year return of 0 percent a year followed by a second-year return of 20 percent a year, which would you choose? Although the average of both choices is 10 percent a year (the average of two tens is 10 and the average of 0 and 20 is 10), the stable growth of the first choice results in more wealth. With the first choice, for every $100 that you invest, you end up with $121; with the second choice, for every $100 that you invest, you end up with $120. Yes, all of $1 less; but what counts is the general principle: For a given average return, where the average is computed simply as the sum of the annual returns divided by the number of years, stable growth is always more valuable than fluctuating growth."

For more, see pages 76-81 of my book. If you do not have the book, you may be able to view the pages on Amazon if you use Amazon's look-inside feature for the book, here.

Wednesday, January 6, 2016

The wisdom of crowds -- growth rate in P/E ratio has contributed nothing to long-term stock-market returns


When you invest in a share of stock, you earn an annual return equal to, roughly, the sum of dividend yield, growth rate in earnings per share, and growth rate in P/E ratio:

\[
annual\,return=dividend\,yield+g_{eps}+g_{p/e\,ratio}
\]

(This formula is from my book, Investing in Dividend Growth Stocks. If you do not have a copy, you may be able to view the relevant pages, 7 through 10, at Amazon, here.)

Dividend yield assumes dividends are paid at the end of the year. Growth rates are defined as change divided by starting value, thus:

\[
g_{eps}=\frac{change\,in\,eps}{eps\,at\,start\,of\,year}
\]

and

\[
g_{p/e\,ratio}=\frac{change\,in\,p/e\,ratio}{p/e\,ratio\,at\,start\,of\,year}
\]

Our definition of annual return states that annual return is dividend yield (with dividends paid at the end of the year) plus a contribution from capital changes -- equal to growth rate in earnings per share plus growth rate in P/E ratio.

The purpose of this post is to show that, historically, of the contribution from capital changes to annual return, almost all has come from growth rate in earnings per share. That is, growth rate in P/E ratio has contributed almost nothing.

The following chart shows beginning-of-year P/E ratios for the S&P 500 between 1 January 1900 and 1 January 2016:


(The data for this chart comes from http://www.multpl.com/table. The 1 January 2016 P/E ratio is an estimate. P/E ratios are based on prices divided by trailing 12-month earnings per share. The median P/E ratio is 14.73; the mean, 15.77.)

More relevant to us, here, is change in P/E ratio. The following chart plots annual change in P/E ratio, 1900 through 2015:


Median annual change over this period, -0.085, is essentially 0. Mean, +0.076, is essentially 0 as well. Historically, therefore, on average, change in P/E ratio essentially equals zero. 

(Change in P/E ratio depends on period studied. Nevertheless, it is still quite small over most reasonably long periods -- exceptions such as the 1990s notwithstanding, though we all know what happened thereafter.)

As a consequence, growth rate in P/E ratio is essentially zero, on average, as well:

\[
g_{eps}=\frac{change\,in\,p/e\,ratio}{p/e\,ratio\,at\,start\,of\,year}=\frac{0}{p/e\,ratio\,at\,start\,of\,year}=0
\]

Returning to our formula for annual return, the only contributions to long-term stock-market annual return are thus, on average, dividend yield and growth rate in earnings per share. Growth rate in P/E ratio, on average, essentially contributes nothing. Going a bit further, quoting from my book, page 10, which, as noted earlier, you may be able to view at Amazon, here: 

"Dividend yield has historically produced about one-third of market returns; capital gains, about two-thirds. Moreover, of the contribution from capital gains, almost all has come from growth rate in earnings per share. That is, over long periods, growth rate in P/E ratio has contributed nothing. Sometimes, it has added. At other times, it has subtracted. Net, it has produced nothing."

Funny how things worked out this way, almost as if scripted -- by some invisible hand, https://en.wikipedia.org/wiki/Invisible_hand. This happy circumstance is probably a testament to, by and large, the stock market operating properly -- the stock market, by and large, pricing things correctly. After all, if P/E ratio is on average correct, change in P/E ratio is on average zero. Occasionally, we have manias -- followed inevitably by panics -- but, averaged over time, the market gets it right, a vindication, perhaps, of the wisdom of (investing) crowds.

Monday, March 4, 2013

Share buybacks: Net is better

Share buybacks are one of two methods that companies use to return capital to shareholders. The other method is dividends.

But share buybacks have many little wrinkles. One that I will discuss here is a subtle one: Look at net share buybacks, not gross share buybacks. That is, subtract from share buybacks the cash that the company receives from the shares that it issues. It seems simple enough but companies often trumpet their share buybacks without asterisking that they offset at least a portion of the buybacks with issued shares during the year.

---

As an example, suppose a company has 400 million shares outstanding. If it buys back 20 million shares in one year, that's 5 percent of its shares outstanding and pretty impressive. But more often than not when you look at the company's financial statements, you will find that the drop in shares outstanding is far less than 5 percent. That's because companies continually issue shares -- and when companies are too generous with share issuance, that 5 percent drop can be anything but. For instance, if in our example the company issues 10 million shares, the drop is 2.5 percent. The gross buyback in this case is 5 percent; the net buyback, 2.5 percent. If the company issues 20 million shares, there is no drop. The gross buyback is still 5 percent; the net buyback is now 0 percent.

---

To be fair, newly issued shares do have benefits. They motivate management and employees; they can be used for acquisitions.

But benefits like these have to be offset against the relatively expensive cost of issuing shares. Equity is a valuable commodity. It should not be doled out like popcorn.

---

This problem is especially endemic with tech companies. Intel may have started this trend a few decades ago -- and it has certainly worked for them. But the trend accelerated in the early 1990s and now borders on the drunken and ridiculous. Yet companies cannot stop. Their employees or managers will just waltz over to the competition, the entity that is still generously doling out shares.

---

Always check how many shares companies issue when they tout how many shares they buy back.


Friday, February 15, 2013

Dividend reinvestment

When you reinvest your dividends, the highest percentage increase in income occurs when the share price is lowest on the prior reinvestment date.

This is the result of the reinvested dividends buying the most number of shares when the share price is low.

---


Conversely, the lowest percentage increase in income occurs when the share price is highest on the prior reinvestment date.

This is the result of the reinvested dividends buying the least number of shares when the share price is high.

---

This is nothing but a variant of "buy low, get more."


Tuesday, February 12, 2013

When stock prices fall

If a stock with a low standard deviation of returns falls by a small amount then in some ways that is equivalent to a much larger fall in a stock with a higher standard deviation of returns.

Why?

True, ipso facto, you lose less when anything falls less...

But that's not the point here....

What is interesting is that from a probabilistic point of view, a stock with a standard deviation of returns of (say) half that of another stock is falling the "equivalent" amount, again in a probabilistic sense, when it falls half as much as the second stock.

In other words, when you buy a stock, you're not just buying the return, you're also buying the risk.

Monday, February 11, 2013

The incompleteness of P/E and P/S models

Neither the P/E models nor the P/S models account for growth. That's problematic.

Why should we pay the same for a one percent grower as a ten percent grower? We shouldn't.

Friday, February 8, 2013

Bigger is better

All else equal (valuations for instance!), pick the biggest and most dominant company in any competitive segment. You'll be far better off.

Two competitors with 80 percent of the market is the type of business to look for.

One competitor with 80 percent is even better -- but, except for a handful of first movers in nascent industries, that's quite rare.

Tuesday, February 5, 2013

The Quality of Management, Warren Buffett

When you invest in a company, the overarching intangible is the quality of its management.

Management pulls all of the strings.

Without superior management, companies cannot succeed.

Warren Buffett will not invest in a company if he does not believe in the quality of its management.

Wednesday, January 23, 2013

Sector earnings for the S&P 500

TTM MA of Sector Earnings for the S&P 500

(Data courtesy of Standard & Poor's)

Generally speaking, stocks follow earnings. For the financials, earnings have been recovering and, not surprisingly, the sector has staged a strong recovery since the mass hysteria of 2008/2009. (Of course, this was after quite a few of them crumpled and the rest were just one Bernanke put expiration date away from purgatory.)

Volatile earnings trends are more suited to traders than investors. Traders yearn for the volatility of prices. Investors should want a slow and steady rise up and to the right. They should not want to buy and sell. For this to work, they need sectors that do not go through stomach-churning drops every now and then.

Trends such as these are evident in graphs of sector earnings. (Even better are long-term graphs of sector earnings.) Consumer staples, for instance, is one such sector for long-term investors. Others are health care (though this one has too much government meddling) and possibly industrials. Earnings don't yo-yo around. Earnings trend slowly and up and to the right.

Still, a lack of volatility is not the only requirement for long-term investors. They also need growth. Thus, the utility sector is generally not a good choice. And valuations, as always, do matter. Finally, as has been proven time and time again, most analyst estimates are biased toward the optimistic end. Many analysts also miss the macroeconomic picture.


Saturday, January 19, 2013

Of preparation and patience in the stock market

"The Tao abides in non-action, yet nothing is left undone." Lao-tzu

In other words, prepare like a maniac before you buy. Pay attention to valuation. Buy only high-quality stocks that can stand the test of time.

Once you have bought, leave your high-quality stocks alone. Don't trade.

Chances are if you trade you'll do yourself more harm than good.

Balance only if things get totally out of whack.

Only once in a generation will you have to pay attention to a mania.

And, again, buy only high-quality stocks that can stand the test of time. Don't buy junk. With the bulk of your assets, don't speculate.

Friday, January 18, 2013

Time

Do not put your long-term investments at risk by investing in companies with weak or varying profits. Stay away from them -- or trade them. These companies are often just one downturn or one bad decision away from disaster. A long-term investment in a weak company must always end badly.

Time hacks away at a weak company's business, slowly but surely sending its share price to zero.

Monday, January 14, 2013

Albert

Einstein

"Everything should be made as simple as possible, but not simpler." Albert Einstein

(Image courtesy of Wikipedia)

---


Simple models of stocks generally lead to wrong conclusions. P/E and PEG models are simple models that often misinform.

---

For instance, a cyclical stock has a low P/E just when it is most dangerously valued.

A stock with a declining business has a low P/E because investors expect nothing, not because it is a good buy.

PEGs tell you nothing about the quality of growth or the following year's growth.

---


You can -- and should -- simplify; but you cannot simplify so much that your Mona Lisa begins to look like a Betty Boop.

Friday, January 11, 2013

Dividend stocks in IRAs, HSAs, and taxable accounts

If you hold dividend stocks in a traditional IRA, you do not have to pay taxes on your dividends but you do have to pay income taxes when you withdraw your money.

If your income tax rate is higher than your dividend tax rate, the savings that you gain from not paying taxes on your dividends today -- even after letting those tax savings compound -- may not be enough to offset what you lose in income taxes later on.

In such cases, depending on how long you hold the stock in the traditional IRA, and this may sound sacrilegious, but it may be better to hold your dividend stocks in a regular taxable account.

For example, if you had the stock for exactly one year in a traditional IRA, you'd pay (say) 25 percent in income taxes when you take the money out. On the other hand, if you had the same stock in a regular taxable account, you'd pay just (say) 15 percent in dividend taxes.

By contrast, because you avoid paying taxes on your dividends forever, you can hold dividend stocks in Roth IRAs and HSAs with impunity.

Thursday, January 10, 2013

The certainty of dividends

Investors prefer the certainty of dividends today versus the hazy promise of share buybacks -- and the uncertainty of higher prices tomorrow.

They may or may not be equivalent but investors do seem to prefer their dividends.

Higher taxes on dividends? Less efficient than share buybacks? So what. Investors don't seem to mind -- or care.

Thursday, January 3, 2013

Relative valuation

Relative valuation never tells you if a stock is overvalued. It only tells you if a stock is overvalued relative to its comparison. You can still lose if the comparison is overvalued.

During the Dot Com Bubble, one internet stock may have looked undervalued relative to another; but, in fact, all were overvalued.