Pages

Showing posts with label forecasts. Show all posts

Wednesday, January 27, 2016

Valuing Chipotle

Ticker: CMG

Sector: Consumer Discretionary

Size: Large-cap

Website: http://www.chipotle.com


A "messy" recent history: In the last few months, Chipotle has had a bad case of burrito indigestion (chipotle.com). Five incidents of outbreaks have been reported (WSJ):

"Since July, there have been a total of five outbreaks linked to Chipotle, including a little-reported case of E. coli that sickened five people in Seattle and which was a different strain unrelated to the larger outbreak that began in October, as well as a norovirus case in Southern California, a salmonella outbreak in Minnesota and the Boston [norovirus] outbreak."

From a close of $720 in September 2015, the stock closed at $448 yesterday, a fall of 38 percent. Its stock chart is a mess -- though the downward momentum of the fourth quarter of 2015 seems to have abated:


Not surprisingly, analysts have ratcheted down their earnings per share estimates sharply. For the fourth quarter of 2015, estimates have fallen 57 percent from $4.37, ninety days ago, to $1.86 today. For 2016, estimates have fallen 37 percent from $20.46, ninety days ago, to $12.86 today (Yahoo! Finance).

In terms of earnings per share, roughly, 2016 represents a setback of 2.5 years.


General Analysis: Chipotle is a high-growth stock, a class of stocks notoriously difficult to value because high growth tends to be unstable. With Chipotle, however, growth is stable, making it easy to value. In this post, I follow the guidelines and format in Twenty dividend growth stocks to consider in Investing in Dividend Growth Stocks (pages 219 - 272) (Amazon). Chipotle is not a dividend growth stock -- it does not pay a dividend -- but its underlying business stability makes it, with one tweak for two scenarios, similar to value. I use Chipotle's results from 2010 through 2014 to unearth the underlying characteristics of the business. Incorporating a messy 2015 would distort the analysis.


The Business: Chipotle sells burritos, tacos, burrito bowls, and salads -- "a few things, thousands of ways" -- at its more than 1,900 fast casual restaurants, primarily in the U.S. The company also operates a much smaller chain of 11 Southeast Asian Kitchen restaurants and invests in an entity that operates 3 Pizzeria Locale restaurants. The company's by-line is "food with integrity." Its grander aim is to change "the way people think about and eat fast food."


Risks: After the outbreaks, will consumers return? According to the company, same restaurant sales fell about 15 percent in the fourth quarter of 2015 (Bloomberg). Nevertheless, I believe consumers will eventually return. With good, honest companies, the underlying business eventually recovers. In the 1980s, Johnson & Johnson had the Tylenol scare. They fixed it. Consumers returned. A few years ago, Johnson & Johnson had problems with manufacturing. They fixed it. Consumers returned. Where there is value -- and integrity -- in the brand, as with Johnson & Johnson and Chipotle; and problems are addressed, as Johnson & Johnson did and Chipotle is doing (chipotle.com), consumers do eventually return.

Of the other risks, commodity costs are one. Consumers do visit restaurants less often during recessions -- though Chipotle's relatively inexpensive food may mean it may not see the dramatic declines symptomatic of higher-priced restaurants.

Few other risks, longer term, meaning, in the next 10 or so years.


The Numbers: Profit margins have averaged ten percent the last five years. Asset turnover is 1.6. Chipotle does not have long-term debt -- in the traditional sense. It does, however, disclose deferred rent obligations. Financial leverage is low, 1.3. Return on equity is 22 percent. Likewise, return on equity has averaged 22 percent the last five years. Moreover, because the company has excess cash and investments on its balance sheet, its "true" return on equity is higher.


Dividends and Share Buybacks: The company does not pay a dividend. The company does buy back shares, mostly, it seems, to offset dilution. Over the last five years, the company has retired its shares at a modest 0.4 percent per year clip. (Comparatively, dividend growth stocks typically retire their shares at a much higher rate, but Chipotle is a high-growth stock. In fact, that it even retires its shares is somewhat of a bonus.)


Spreadsheet Parameters: (I use the spreadsheet described in Investing in Dividend Growth Stocks (Amazon) -- with a slight tweak to adjust for the possibility of a robust recovery in earnings per share -- to value the stock. See pages 158 - 176.) Actual dividend payout ratio of 0 percent; assumed payout ratio of 35 percent. Return on beginning equity: 30 percent. It is currently 29 percent. It has averaged 27 percent the last five years. In fact, because the company has excess cash and investments on its balance sheet, its "true" return on beginning equity is higher -- I am likely conservative with my 30 percent. Earnings growth has averaged an impressive 29 percent the last five years. Few large companies can sustain such high growth rates over long periods and, in that sense, Chipotle is one of the rare ones. Dividend growth: n/a. Earnings per share growth roughly mirrors earnings growth because share buybacks are muted. Chipotle operates more than 1,900 restaurants. The company opens more than 200 net new restaurants a year. It is not unreasonable to assume they can maintain this pace for at least the next several years. I do not believe the market is near saturation. For instance, McDonald's is virtually everywhere in the U.S. -- and McDonald's has 14,300 U.S. restaurants (though they do intend to close a handful this year (New York Times)). Moreover, Chipotle will almost certainly expand outside the U.S. more aggressively at some point and the company is testing a few new restaurant ideas. Reasonable growth rates for our spreadsheet, if sales were to resume their historical growth rates: (Years 1-5: 26 percent) (Years 6-10: 22 percent) (Years 11-20: 16 percent) (Years 21-30: 10 percent) (Years 31+: 3 percent).


Sample Spreadsheet Results: Because earnings per share can vary dramatically the next several quarters, I use four potential scenarios to gauge the scope of variability:

  • (1) Reset -- current depressed earnings per share.
  • (2) Quick Reset -- higher current earnings per share.
  • (3) Reset ++ -- current depressed earnings per share, then full recovery next year.
  • (4) Quick Reset ++ -- higher current earnings per share, then full recovery next year.

Explicitly, I use the following values:

Scenario Stock Price EPS - current P/E ratio - current EPS - next
(1) 450 11 41 13.86
(2) 450 15 30 18.90
(3) 450 11 41 22.55
(4) 450 15 30 22.55

These earnings per share are for periods centered on January 1 -- thus the last 6 months of 2015 plus the first 6 months of 2016 for the current period, for example.

Of course, even within these patterns, we have many other possibilities -- but at least they help establish a range. Using a current stock price of $450, and the spreadsheet described in Investing in Dividend Growth Stocks (Amazon), I get the following results:

Scenario Expected Return
(1) 12.33%
(2) 13.85%
(3) 14.80%
(4) 14.79%

Screenshots from the spreadsheet for scenario (3), also showing the slight tweak in red (also needed in scenario (4)) I made in the Projections section:


These are long-term returns. All are outstanding -- because growth remains deliciously high. If Chipotle produces these gains, investors will be well ahead of the market. That said, none of these results make any sense if growth permanently collapses (YouTube) but I do not believe this happens.

In addition, risk is not low under any of our scenarios -- as the relatively high P/E ratios attest.

As a comparison, if we were to live in a parallel universe (YouTube), with the recent company-specific indigestion nonexistent and Chipotle humming along, at a stock price of (say) $600 (to account for the recent market decline -- the market still declines in the parallel universe) and earnings per share of $19, all other assumptions the same as above, the expected return is 13.59 percent a year -- and, yes, with a P/E ratio of 32, the stock is still not low risk. Blame those high P/E ratios -- even in the parallel universe.


Disclosure: I own a tiny position in Chipotle, entirely for fun. I always order a carnitas burrito. It rocks. Do not interpret this post as a recommendation to buy or sell or trade or whatever, including buying a Chipotle burrito. Always do -- and depend -- on your due diligence.

Wednesday, January 13, 2016

2016's week 1 return among the 50 worst since 1950

The following plot shows the 50 worst weekly returns of the S&P 500 since 1950 (data from Yahoo! Finance):


The first week of 2016, highlighted in the upper right, is bad -- but not the worst. The worst is the 18.2 percent loss for the week ending October 10. If you recall that amusing period, within a week, Warren Buffett wrote "Buy American, I Am," http://www.nytimes.com/2008/10/17/opinion/17buffett.html, where he advocated being greedy during periods when others are fearful:

"Be fearful when others are greedy, and be greedy when others are fearful. And most certainly, fear is now widespread, gripping even seasoned investors."

Fear is not quite as widespread now as it was then but this thumping has likely taken quite a few investors back to the days of Fall 2008's halcyon panic. Undoubtedly, the market looks awful now -- and the carnage has started to become indiscriminate. A number of decent stocks have been hit, based entirely (most likely) on margin calls, stocks that will nevertheless report excellent numbers in the quarters ahead.

This table shows that the first week of 2016 -- with a weekly return of -5.96% -- is 32nd on the list of worst weekly returns since 1950:


Based on the full set of data, the chance of getting such a bad week (a weekly return of roughly -5% or worse) is roughly 15 out of 1,000 or roughly 1 out of 70 or roughly one week every 16 months. The market did not encounter any such weeks during 2012, 2013, and 2014. In 2015, it encountered one - the week ending 08/21/2015. That week, which saw a loss of -5.77%, is 36th on the list.

Perhaps we are due. Buckle up? Typically, these things do tend to occur in clusters:


This pattern shows clustering -- a tendency for movements to occur close to each other. Certainly, the movements are not random, in the sense that they occur somewhat regularly but without any discerning pattern. This is very different from movements about the mean or 0 -- which do show randomness. For instance, in an earlier post, we saw that randomness is characteristic of monthly returns about 0. Sharp falls have a separate nature unto themselves. They occur relatively rarely and they tend to cluster. Of course, predicting the first is next to impossible. Once you have the first, however, you can be reasonably sure of one or two others upcoming. Maybe.

In my book, Investing in Dividend Growth Stocks, I emphasize stability of returns for long-term investors precisely because I am not a fan of extreme movements for the typical long-term holder of any stock (you have no choice if you hold the market, which I am also not a huge fan of, but that story is for another day). Moreover, it is not difficult to show that if you have stability in your returns you tend to have a higher compounded return (read: wealth), all else equal. When you invest in unstable stocks and many markets you have to be certain not to get continually hammered as your long-term returns will invariably suffer. With generally stable markets such as the U.S. market, this "suffering" is not nearly as great as it is with many other markets. Essentially, this has to do with excess volatility acting like a leech, bleeding off your compounded return, hence wealth. From my book:

"If you had to choose between (a) two years of returns at 10 percent a year and (b) a first-year return of 0 percent a year followed by a second-year return of 20 percent a year, which would you choose? Although the average of both choices is 10 percent a year (the average of two tens is 10 and the average of 0 and 20 is 10), the stable growth of the first choice results in more wealth. With the first choice, for every $100 that you invest, you end up with $121; with the second choice, for every $100 that you invest, you end up with $120. Yes, all of $1 less; but what counts is the general principle: For a given average return, where the average is computed simply as the sum of the annual returns divided by the number of years, stable growth is always more valuable than fluctuating growth."

For more, see pages 76-81 of my book. If you do not have the book, you may be able to view the pages on Amazon if you use Amazon's look-inside feature for the book, here.

Wednesday, January 6, 2016

The wisdom of crowds -- growth rate in P/E ratio has contributed nothing to long-term stock-market returns


When you invest in a share of stock, you earn an annual return equal to, roughly, the sum of dividend yield, growth rate in earnings per share, and growth rate in P/E ratio:

\[
annual\,return=dividend\,yield+g_{eps}+g_{p/e\,ratio}
\]

(This formula is from my book, Investing in Dividend Growth Stocks. If you do not have a copy, you may be able to view the relevant pages, 7 through 10, at Amazon, here.)

Dividend yield assumes dividends are paid at the end of the year. Growth rates are defined as change divided by starting value, thus:

\[
g_{eps}=\frac{change\,in\,eps}{eps\,at\,start\,of\,year}
\]

and

\[
g_{p/e\,ratio}=\frac{change\,in\,p/e\,ratio}{p/e\,ratio\,at\,start\,of\,year}
\]

Our definition of annual return states that annual return is dividend yield (with dividends paid at the end of the year) plus a contribution from capital changes -- equal to growth rate in earnings per share plus growth rate in P/E ratio.

The purpose of this post is to show that, historically, of the contribution from capital changes to annual return, almost all has come from growth rate in earnings per share. That is, growth rate in P/E ratio has contributed almost nothing.

The following chart shows beginning-of-year P/E ratios for the S&P 500 between 1 January 1900 and 1 January 2016:


(The data for this chart comes from http://www.multpl.com/table. The 1 January 2016 P/E ratio is an estimate. P/E ratios are based on prices divided by trailing 12-month earnings per share. The median P/E ratio is 14.73; the mean, 15.77.)

More relevant to us, here, is change in P/E ratio. The following chart plots annual change in P/E ratio, 1900 through 2015:


Median annual change over this period, -0.085, is essentially 0. Mean, +0.076, is essentially 0 as well. Historically, therefore, on average, change in P/E ratio essentially equals zero. 

(Change in P/E ratio depends on period studied. Nevertheless, it is still quite small over most reasonably long periods -- exceptions such as the 1990s notwithstanding, though we all know what happened thereafter.)

As a consequence, growth rate in P/E ratio is essentially zero, on average, as well:

\[
g_{eps}=\frac{change\,in\,p/e\,ratio}{p/e\,ratio\,at\,start\,of\,year}=\frac{0}{p/e\,ratio\,at\,start\,of\,year}=0
\]

Returning to our formula for annual return, the only contributions to long-term stock-market annual return are thus, on average, dividend yield and growth rate in earnings per share. Growth rate in P/E ratio, on average, essentially contributes nothing. Going a bit further, quoting from my book, page 10, which, as noted earlier, you may be able to view at Amazon, here: 

"Dividend yield has historically produced about one-third of market returns; capital gains, about two-thirds. Moreover, of the contribution from capital gains, almost all has come from growth rate in earnings per share. That is, over long periods, growth rate in P/E ratio has contributed nothing. Sometimes, it has added. At other times, it has subtracted. Net, it has produced nothing."

Funny how things worked out this way, almost as if scripted -- by some invisible hand, https://en.wikipedia.org/wiki/Invisible_hand. This happy circumstance is probably a testament to, by and large, the stock market operating properly -- the stock market, by and large, pricing things correctly. After all, if P/E ratio is on average correct, change in P/E ratio is on average zero. Occasionally, we have manias -- followed inevitably by panics -- but, averaged over time, the market gets it right, a vindication, perhaps, of the wisdom of (investing) crowds.

Sunday, January 3, 2016

The randomness of monthly returns and the Lake Wobegon effect

More than 70% of U.S. drivers believe they are better-than-average drivers, an example of the Lake Wobegon effect, https://en.wikipedia.org/wiki/Lake_Wobegon#The_Lake_Wobegon_effect.

Likewise, a higher than expected number of investors probably believe they are better-than-average investors. Essentially, in the stock market, this means they can spot patterns. For instance, they believe they can pick the perfect stock. They believe they know when to buy and when to sell. They believe they know when to exit the market. Most of this is hindsight bias as well -- investors looking at the past and saying they would have bought this or that at the right time and sold this or that at the right time. I am not saying it is not possible but it isn't easy. Some may certainly know how -- but it is likely very few.

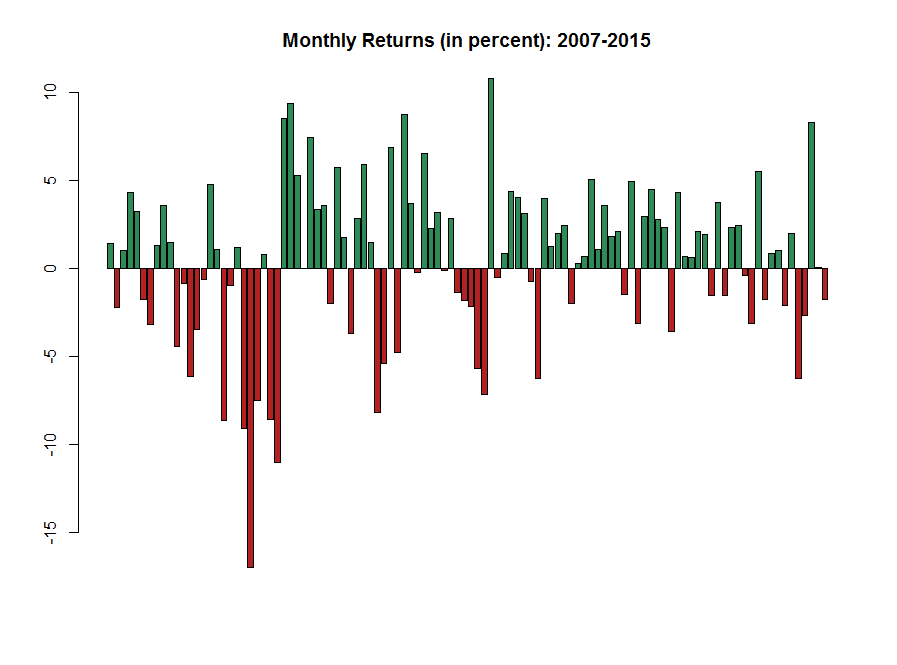
The following chart shows the monthly returns (in percent) for the S&P 500, price only, between 2007 and 2015:


I took the returns and simply characterized them as up or down in the following chart:


Perhaps there are patterns here and maybe some say they are obvious. But are they? I used a statistical test called a runs test to check the randomness of the pattern. When I ran the test, I got a result that indicated the pattern was very likely random. In turn, this means monthly returns are very likely random. (In statistical jargon, I get a p-value of 0.8782. Generally, for this test, a p-value below 0.05 suggests a lack of randomness. Here, the p-value is significantly larger than 0.05 -- thus suggesting randomness.) 

If the result of a game is random, it is difficult to play the game many, many times and finish significantly above average -- regardless of what we think of our abilities. Sometimes we get it right. At other times, we get it wrong. Few of us get it consistently right -- and that too is explainable mostly as luck. Think of it this way: You, or I -- or even the residents of Lake Wobegon -- cannot consistently call the next flip of a coin.

Wednesday, December 30, 2015

The error in analyst stock-price targets


Typically, analysts generate a (one-year) stock-price target by taking the product of P/E ratio, estimated one year out, and earnings per share, E, also estimated one year out:

\[ Price\:Target=\frac{P}{E}*E \]

All such estimates are subject to error. The error in doing so is given by:

\[ Error_{Price\,Target}=\sqrt{\left(Error_{P/E}\right)^{2}+\left(Error_{E}\right)^{2}} \]

Error in Analyst Stock-Price Target


For a typical stock, we can assume an error of 10% in P/E ratio, a not unreasonable value, and 5% in earnings per share, E -- typically lower than error in P/E ratio for many, but certainly not all,  stocks. Putting these values into the above equation we get:

\[ Error_{Price\,Target}=\sqrt{\left(0.10\right)^{2}+\left(0.05\right)^{2}} \]

Or:

\[ Error_{Price\,Target}=11\% \]

View this 11% as the minimum error of almost any analyst (one-year) stock-price target (exceptions: sedate stocks such as utilities and consumer staples stocks where the error is lower). Thus if the stock price is currently 50 and the analyst expects it to be 60 based on her estimates, the actual stock-price target is 60 + or - 11%, thus, 53 to 67. Consider how wide this range is relative to the point estimate of 60. If price targets were ever reported this way, investors would immediately appreciate the problems inherent in this type of prediction.

In effect, the problem arises because 11% approaches the expected return of a typical stock and the error essentially overwhelms the return implied in the stock-price target. For instance, a more reasonable -- and typical -- analyst stock-price target in the previous example is 55. In this case, the actual stock-price target is 55 + or - 11%, thus, 49 to 61, a wide range, to say the least. Contrast this with the target of 55 and the current price of 50. The current price is within this range! The expected returns (assuming no dividends) range from -2% (if the stock hits 49) to 22% (if the stock hits 61). Many consider this range of returns -- quite correctly -- absurd. It's a bit like standing on a scale and having the scale read 170 pounds + or - something totally unreasonable, (say), 20 pounds.

Incidentally, P/E ratios of certain stocks vary much more than 10%. In these cases, stock-price targets calculated as P/E ratio times earnings are almost pointless. For instance, with an error of 25% in P/E ratio and 15% in earnings per share, the error in analyst (one-year) stock-price target is 29%. That's big enough to drive a Hummer through.

Finally, note that the bulk of the error in both cases is because of error in P/E ratio. It is a truism that P/E ratios are almost impossible to judge a year out (or indeed over any long period). This means that not only are analyst stock-price targets one year out fraught with error, as we have seen, but that valuation methods that depend on estimates of P/E ratio are fraught with error too -- and must be questioned. Too often, investors and analysts generate a stock-price target by multiplying estimated P/E ratio by estimated earnings per share, not realizing the potentially catastrophic mistake that they are making. They put a lot of thought into estimating earnings per share, but, for most stocks, the (expected large) error in P/E ratio brings into question the ultimate validity of any stock-price target calculated this way.

Wednesday, January 23, 2013

Sector earnings for the S&P 500

TTM MA of Sector Earnings for the S&P 500

(Data courtesy of Standard & Poor's)

Generally speaking, stocks follow earnings. For the financials, earnings have been recovering and, not surprisingly, the sector has staged a strong recovery since the mass hysteria of 2008/2009. (Of course, this was after quite a few of them crumpled and the rest were just one Bernanke put expiration date away from purgatory.)

Volatile earnings trends are more suited to traders than investors. Traders yearn for the volatility of prices. Investors should want a slow and steady rise up and to the right. They should not want to buy and sell. For this to work, they need sectors that do not go through stomach-churning drops every now and then.

Trends such as these are evident in graphs of sector earnings. (Even better are long-term graphs of sector earnings.) Consumer staples, for instance, is one such sector for long-term investors. Others are health care (though this one has too much government meddling) and possibly industrials. Earnings don't yo-yo around. Earnings trend slowly and up and to the right.

Still, a lack of volatility is not the only requirement for long-term investors. They also need growth. Thus, the utility sector is generally not a good choice. And valuations, as always, do matter. Finally, as has been proven time and time again, most analyst estimates are biased toward the optimistic end. Many analysts also miss the macroeconomic picture.


Wednesday, January 9, 2013

Stocks could rise 10 percent in 2013


The S&P 500 might hit an all-time high.

Market P/E expected to rise.

---


Growth sectors expected to outperform.

Defensive sectors expected to underperform.

Technology, industrials, and energy are the best sector bets.

---

Source: Barron's