Wednesday, December 30, 2015
The error in analyst stock-price targets
Typically, analysts generate a (one-year) stock-price target by taking the product of P/E ratio, estimated one year out, and earnings per share, E, also estimated one year out:
\[ Price\:Target=\frac{P}{E}*E \]
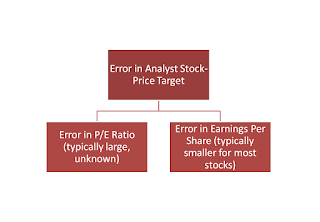
All such estimates are subject to error. The error in doing so is given by:
\[ Error_{Price\,Target}=\sqrt{\left(Error_{P/E}\right)^{2}+\left(Error_{E}\right)^{2}} \]
For a typical stock, we can assume an error of 10% in P/E ratio, a not unreasonable value, and 5% in earnings per share, E -- typically lower than error in P/E ratio for many, but certainly not all, stocks. Putting these values into the above equation we get:
\[ Error_{Price\,Target}=\sqrt{\left(0.10\right)^{2}+\left(0.05\right)^{2}} \]
Or:
\[ Error_{Price\,Target}=11\% \]
View this 11% as the minimum error of almost any analyst (one-year) stock-price target (exceptions: sedate stocks such as utilities and consumer staples stocks where the error is lower). Thus if the stock price is currently 50 and the analyst expects it to be 60 based on her estimates, the actual stock-price target is 60 + or - 11%, thus, 53 to 67. Consider how wide this range is relative to the point estimate of 60. If price targets were ever reported this way, investors would immediately appreciate the problems inherent in this type of prediction.
In effect, the problem arises because 11% approaches the expected return of a typical stock and the error essentially overwhelms the return implied in the stock-price target. For instance, a more reasonable -- and typical -- analyst stock-price target in the previous example is 55. In this case, the actual stock-price target is 55 + or - 11%, thus, 49 to 61, a wide range, to say the least. Contrast this with the target of 55 and the current price of 50. The current price is within this range! The expected returns (assuming no dividends) range from -2% (if the stock hits 49) to 22% (if the stock hits 61). Many consider this range of returns -- quite correctly -- absurd. It's a bit like standing on a scale and having the scale read 170 pounds + or - something totally unreasonable, (say), 20 pounds.
Incidentally, P/E ratios of certain stocks vary much more than 10%. In these cases, stock-price targets calculated as P/E ratio times earnings are almost pointless. For instance, with an error of 25% in P/E ratio and 15% in earnings per share, the error in analyst (one-year) stock-price target is 29%. That's big enough to drive a Hummer through.
Finally, note that the bulk of the error in both cases is because of error in P/E ratio. It is a truism that P/E ratios are almost impossible to judge a year out (or indeed over any long period). This means that not only are analyst stock-price targets one year out fraught with error, as we have seen, but that valuation methods that depend on estimates of P/E ratio are fraught with error too -- and must be questioned. Too often, investors and analysts generate a stock-price target by multiplying estimated P/E ratio by estimated earnings per share, not realizing the potentially catastrophic mistake that they are making. They put a lot of thought into estimating earnings per share, but, for most stocks, the (expected large) error in P/E ratio brings into question the ultimate validity of any stock-price target calculated this way.
Subscribe to:
Posts (Atom)
